


Published on by James Archer
*This article was originally published on Forty.co. Forty is now Crowd Favorite.
Every year, Inc. magazine ranks the 5,000 fastest-growing companies (privately held) in the United States.
When they released their 2011 list, providing a fresh set of data on the movers and shakers across all industries, we compiled and analyzed this data, comparing it against general business data provided by the U.S. Census Bureau, to uncover some clues about what makes the Inc. 5000 companies different from the more average businesses out there.
(We grouped the data into ranges based on annual revenue to ensure similar companies were being compared. We’ve also limited our discussion here to companies with revenue less than $100 million since there wasn’t enough data on $100 million+ companies to make effective comparisons.)
The results were surprising and may challenge some preconceived notions about high-growth companies. It’s easy to assume that rapid business growth is universally a good thing, but this data shows that rapid growth definitely comes with compromises.
Average employee counts
The first set of data we analyzed was the average number of employees per company. Here’s what we found:
| Revenue (mil) |
Employees (Census) |
Employees (Inc 5000) |
% |
|---|---|---|---|
| 2.5 to 5.0 | 25 | 34 | 136% |
| 5.0 to 7.5 | 39 | 59 | 151% |
| 7.5 to 10 | 52 | 68 | 131% |
| 10 to 15 | 69 | 105 | 152% |
| 15 to 20 | 92 | 134 | 146% |
| 20 to 25 | 109 | 139 | 128% |
| 25 to 30 | 132 | 200 | 152% |
| 30 to 35 | 154 | 247 | 160% |
| 35 to 40 | 169 | 243 | 144% |
| 40 to 45 | 186 | 231 | 124% |
| 45 to 50 | 207 | 290 | 140% |
| 50 to 75 | 255 | 363 | 142% |
| 75 to 100 | 360 | 712 | 198% |
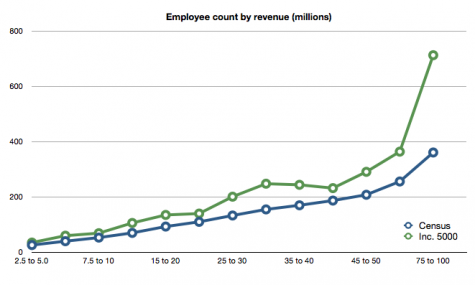
As you can see, there’s a pretty consistent trend that Inc. 5000 companies have significantly more employees than general businesses in their same revenue group. On average, Inc. 5000 companies employ 53% more employees than normal companies generating the same annual revenue.
Revenue per capita
You can look at this data another way, in terms of how much revenue is generated per employee.
| Revenue (mil) |
Per capita (Census) |
Per capita (Inc. 5000) |
% |
|---|---|---|---|
| 2.5 to 5.0 | $140,049 | $106,360 | 76% |
| 5.0 to 7.5 | $154,877 | $104,174 | 67% |
| 7.5 to 10 | $164,620 | $127,001 | 77% |
| 10 to 15 | $174,874 | $117,139 | 67% |
| 15 to 20 | $188,013 | $129,252 | 69% |
| 20 to 25 | $203,921 | $160,932 | 79% |
| 25 to 30 | $207,563 | $137,340 | 66% |
| 30 to 35 | $210,381 | $131,126 | 62% |
| 35 to 40 | $221,484 | $154,032 | 70% |
| 40 to 45 | $226,833 | $182,774 | 81% |
| 45 to 50 | $228,427 | $163,314 | 71% |
| 50 to 75 | $238,593 | $167,690 | 70% |
| 75 to 100 | $240,056 | $122,462 | 51% |
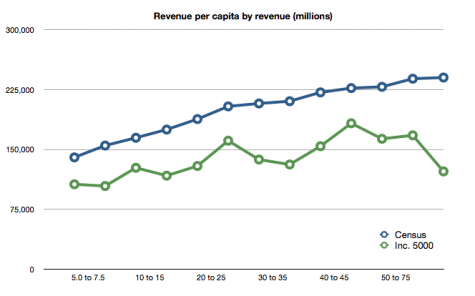
On average, an Inc. 5000 company generates 31% less revenue per employee than normal companies do. That may be a surprise to those who associate “high growth” with “high profits.”
Impact on salaries
While the averages vary by industry, it’s normal for overall payroll budget to be calculated as a percentage of annual revenue. Some industries average as high as 50% of revenue going toward payroll, while others can be as low as 20%.
With the Inc. 5000 trend toward having 50% more employees to generate the same amount of revenue, you can imagine the impact this must have on salaries.
For example, let’s say you’re in a $10 million/year company in an industry that traditionally puts 30% of annual revenue toward payroll. At a normal company, your average share of payroll might be $43,000, while at an Inc. 5000 company, that might look more like $29,000.
It could be that these companies are paying competitive salaries by taking that money from somewhere else. Either way, they have a lot of mouths to feed, so there’s less pie to go around.
What does it all mean?
First, the obligatory disclaimer: this data comes from different sources with different approaches and restrictions, so while it’s possible to extract useful insights from the averages, you should keep in mind we’re comparing two sets of data with different imperfections, and these conclusions are generally speculative.
It’s easy to feel like “high-growth” companies equate to massive success, high margins, everyone making money, etc., but the reality of the Inc. 5000 data (when compared to census data on general businesses in the same revenue range) seems to paint a different picture.
It would appear these companies are growing faster than normal partially by hiring at an accelerated pace. Even if this leads to actually running less efficiently (in terms of revenue per capita) than normal companies, they’re apparently overcoming that barrier by adding people so fast that their overall revenue keeps growing.
While this growth increases the bottom line, there are risks and compromises that come with it. Lower efficiency means everyone’s getting paid less than they would at a high-efficiency company, and the overall profit margins are probably lower too.
“Lower efficiency means everyone’s getting paid less than they would at a high-efficiency company, and the overall profit margins are probably lower too.”
Knowing this, it’s important for company principals to sit down and really figure out what they want to accomplish from a business perspective. For some, that bottom-line growth may be exactly what they’re looking for (“blow it up and cash out”). Others may benefit more from a slower, long-term approach that increases their overall efficiency (in terms of revenue per capita) and reduces the risk of their company growing out of control and losing its way.
However you decide to run your company, make sure you’re actually pursuing defined strategic goals and not just pursuing “growth for growth’s sake.” Rapid business growth can introduce some significant risks and actually reduce profit, so it’s important to take that into account when planning your company’s future.
This rapid growth approach can also directly affect your marketing efforts (which can help secure the future of your company). It’s tempting to pull back on long-term marketing efforts in favor of feeding immediate growth, but just remember that the high-adrenaline momentum is never stable, and you’ll need a solid foundation in place for when things start to shift (which is probably happening right now).
The same team and processes that made Forty synonymous with high-quality UX design and content strategy have been extended through integration with Crowd Favorite.
If you have a digital project in mind, now’s a great time to reach out!